COT - Institutional Positioning
The Commitment of Traders (COT) analysis reveals how institutional traders are positioned in the forex market, providing valuable insight into potential trend continuations or reversals. Published weekly by the Commodity Futures Trading Commission (CFTC), the COT report details market positions held by various trader groups.
Our analysis focuses specifically on "non-commercial" traders—often considered institutional or speculative traders—to provide a clear gauge of dominant market sentiment and positioning across major FX pairs. This data can be used both as trend confirmation and as a contrarian indicator when combined with Intrinsic Analysis and Cross-Pair Analysis.
COT Overview Dashboard
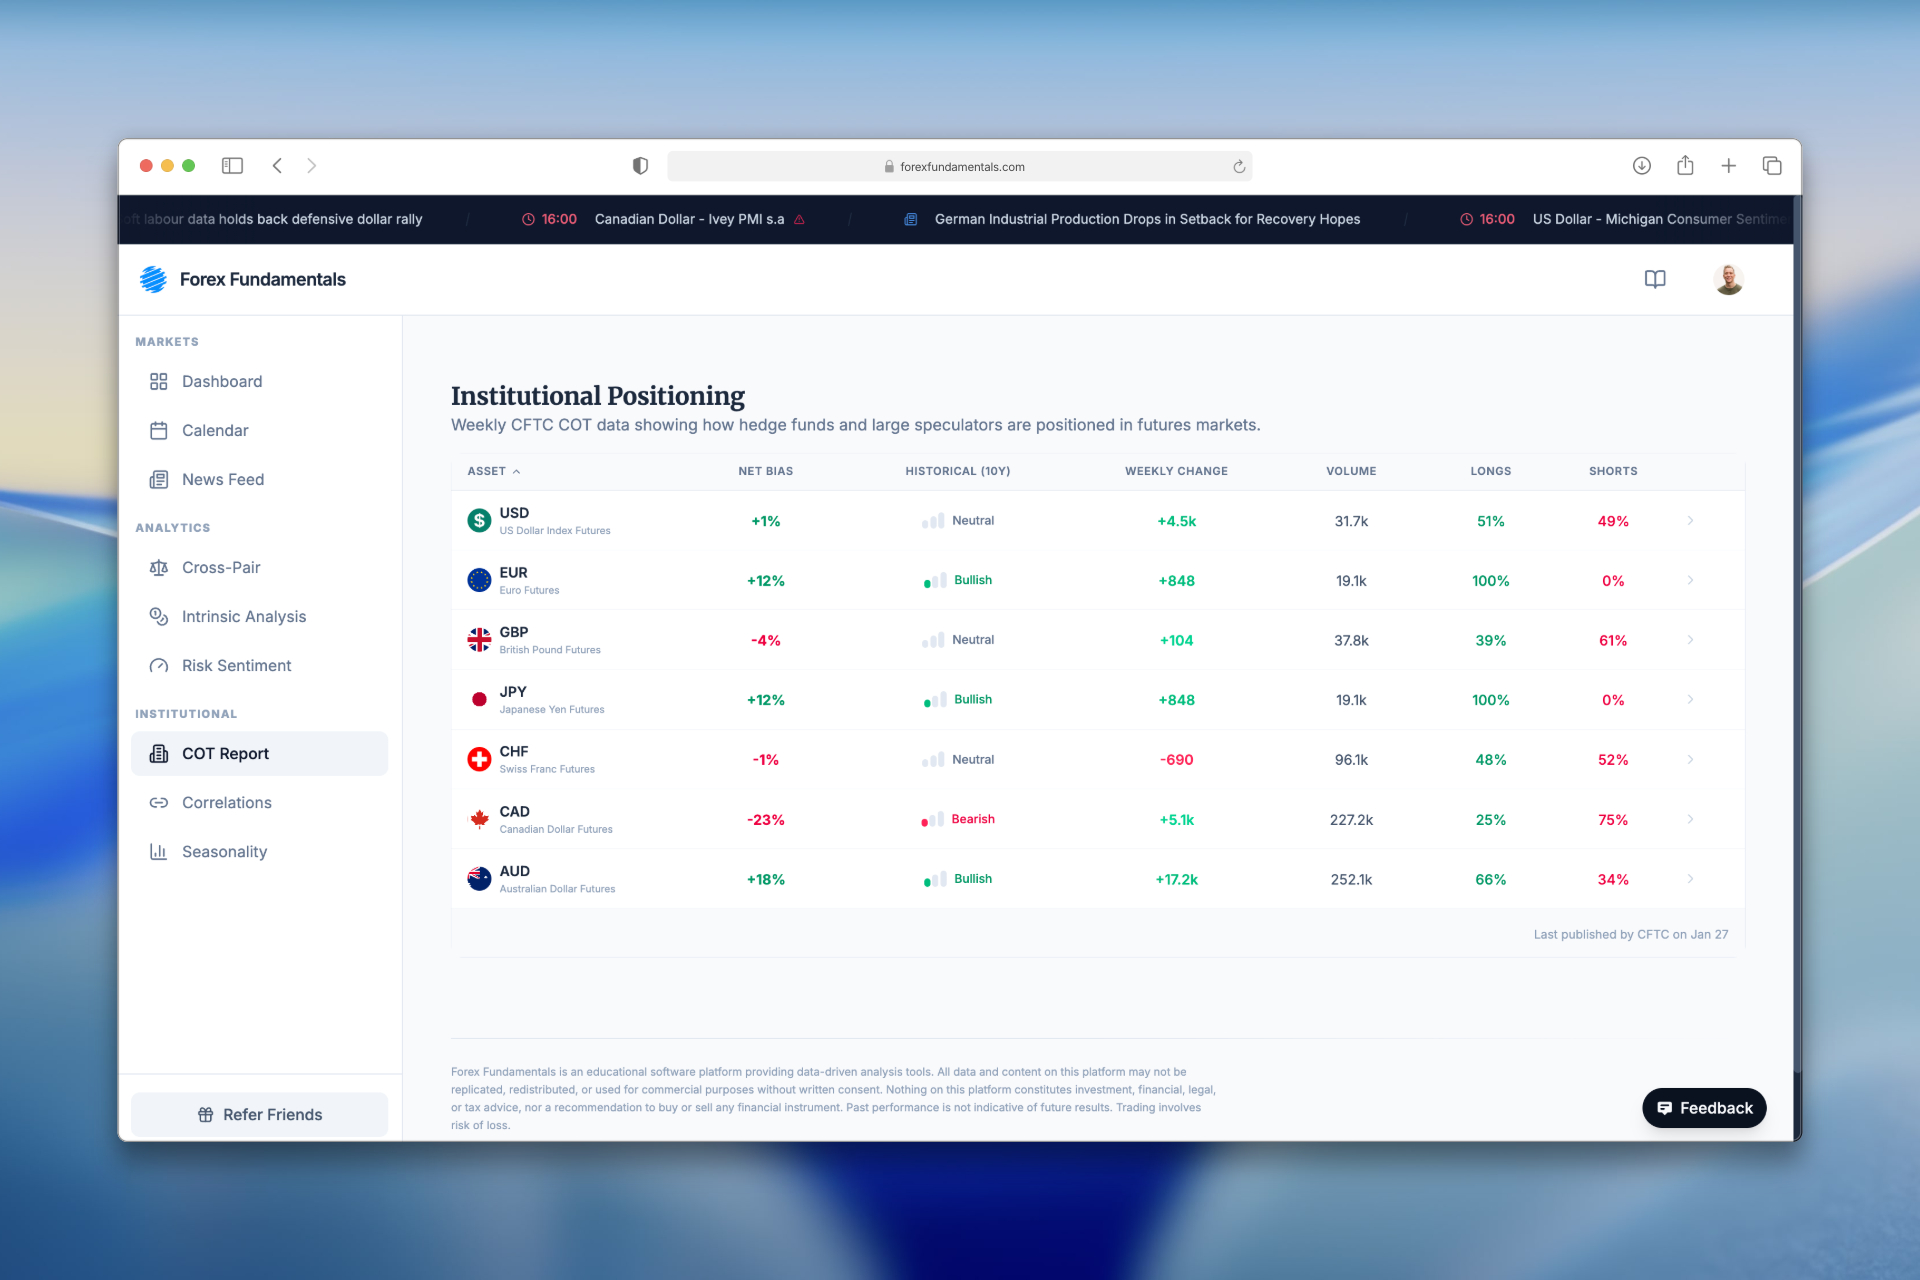
The overview dashboard displays tiles for all major currency pairs, showing current Long/Short positions, weekly changes, the FLIP score (net positioning), and historical percentile rankings. This allows you to quickly identify which currencies institutional traders are heavily long or short.
Detailed Pair Analysis
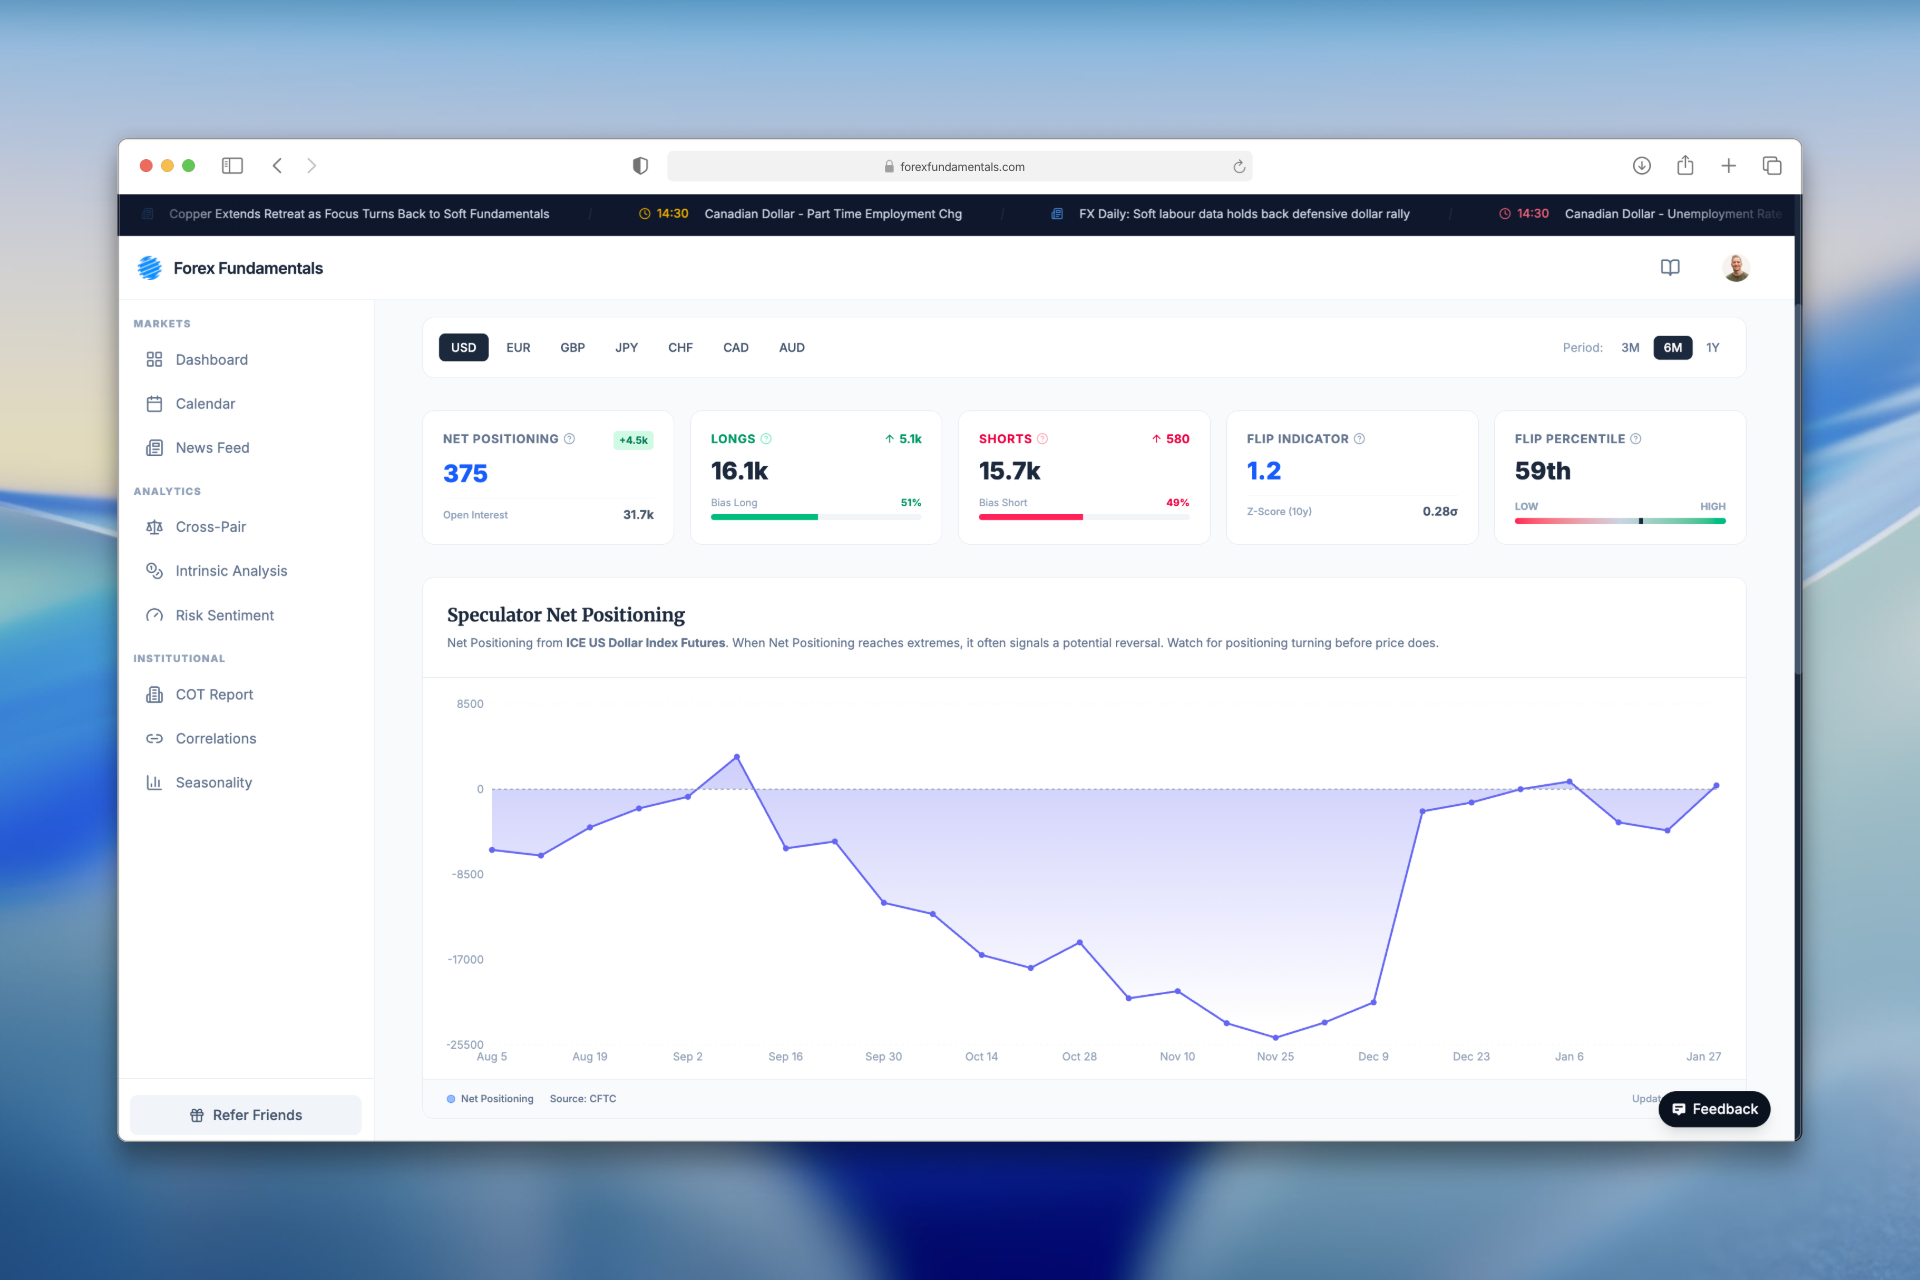
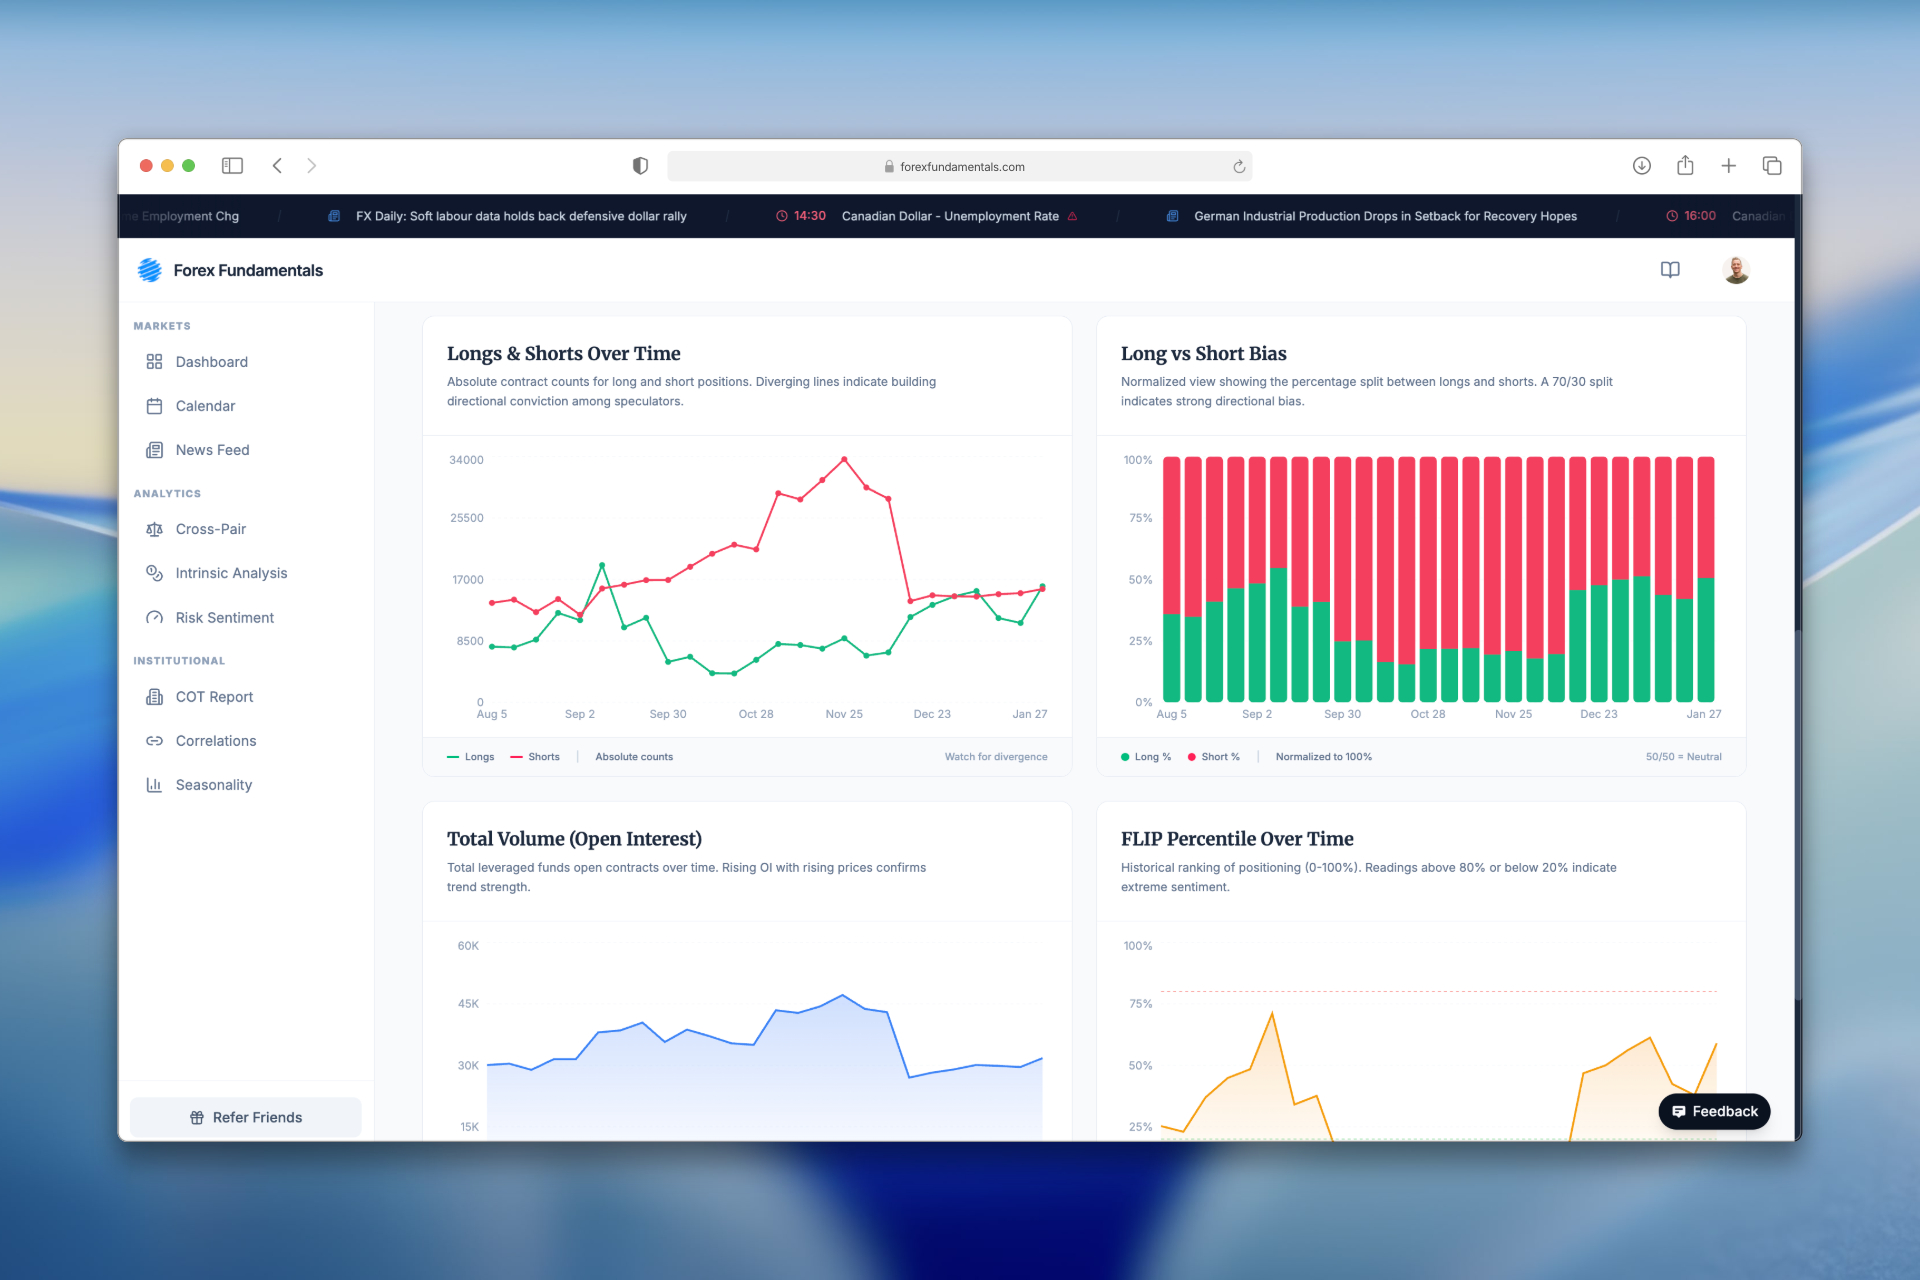
Clicking on any currency pair reveals detailed historical analysis including positioning trends over time, FLIP score evolution, correlation with price action, and raw data tables for in-depth analysis.
Understanding the COT
The COT analysis is broken down into two main parts: a high-level overview dashboard and detailed, asset-specific analysis pages.
Interpretation & Strategy
Analyzing COT data provides valuable insights into market dynamics, especially when correlated with price action. When institutional traders reach extreme long or short positions, often indicated by high or low FLIP percentiles, it can signal potential trend reversals. It is important to note, however, that markets can remain in "overbought" or "oversold" conditions for extended periods. Therefore, it is crucial to combine COT data with other technical and fundamental indicators to confirm potential trading signals.
Trend Confirmation Approach
A common application is to analyze COT data in conjunction with price charts. For example, if institutional traders are increasing their long positions while the price is rising, it may serve as a confirmation of the bullish trend. Conversely, if traders are reducing their long positions while the price is still rising, it could indicate weakening conviction and a potential trend reversal.
Contrarian Approach
Some traders also use COT data as a contrarian indicator, betting against the prevailing sentiment of institutional traders. If institutional traders are heavily long (a high percentile), a contrarian trader might take a short position, anticipating market exhaustion and a potential reversal. This approach can be risky, and it is important to have a solid risk management strategy in place.
Integration with Other Tools
COT Positioning data becomes most powerful when integrated with other analytical tools:
- With Intrinsic Analysis: See if institutional positioning aligns with or contradicts fundamental currency strength
- With Cross-Pair Analysis: Use COT data as an additional confluence factor when evaluating pair opportunities
- With Market Sentiment: Understand if institutional positioning matches the current Risk-On/Risk-Off environment
- With News Sentiment: Identify whether recent news is likely to accelerate existing institutional trends or trigger position unwinding